
mutation predictions | marginal predictions | summary statistics | genome diff | command line log
|
breseq version 0.33.1 revision 8505477f25b3
mutation predictions | marginal predictions | summary statistics | genome diff | command line log |
| read file | reads | bases | passed filters | average | longest | mapped | |
|---|---|---|---|---|---|---|---|
| errors | Plate-2-BOP-1000-PFKA-ALE-3-flask-12_S53_L001_R1_001.good.fq | 201,861 | 27,476,974 | 100.0% | 136.1 bases | 149 bases | 96.5% |
| errors | Plate-2-BOP-1000-PFKA-ALE-3-flask-12_S53_L001_R2_001.good.fq | 201,861 | 27,306,646 | 100.0% | 135.3 bases | 149 bases | 98.0% |
| errors | Plate-2-BOP-1000-PFKA-ALE-3-flask-12_S53_L002_R1_001.good.fq | 162,781 | 22,116,647 | 100.0% | 135.9 bases | 149 bases | 96.2% |
| errors | Plate-2-BOP-1000-PFKA-ALE-3-flask-12_S53_L002_R2_001.good.fq | 162,781 | 21,981,798 | 100.0% | 135.0 bases | 149 bases | 97.3% |
| errors | Plate-2-BOP-1000-PFKA-ALE-3-flask-12_S53_L003_R1_001.good.fq | 182,140 | 24,743,584 | 100.0% | 135.8 bases | 149 bases | 96.3% |
| errors | Plate-2-BOP-1000-PFKA-ALE-3-flask-12_S53_L003_R2_001.good.fq | 182,140 | 24,584,388 | 100.0% | 135.0 bases | 149 bases | 97.9% |
| errors | Plate-2-BOP-1000-PFKA-ALE-3-flask-12_S53_L004_R1_001.good.fq | 159,249 | 21,577,347 | 100.0% | 135.5 bases | 149 bases | 96.0% |
| errors | Plate-2-BOP-1000-PFKA-ALE-3-flask-12_S53_L004_R2_001.good.fq | 159,249 | 21,441,095 | 100.0% | 134.6 bases | 149 bases | 97.3% |
| total | 1,412,062 | 191,228,479 | 100.0% | 135.4 bases | 149 bases | 97.0% |
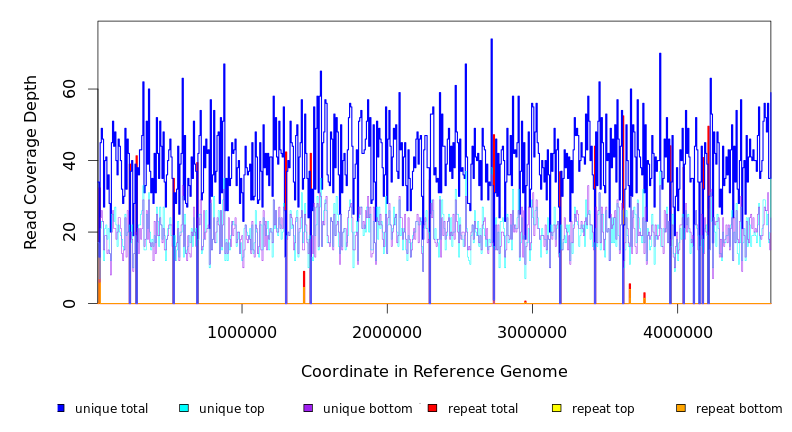
| seq id | length | fit mean | fit dispersion | % mapped reads | description | ||
|---|---|---|---|---|---|---|---|
| coverage | distribution | NC_000913 | 4,641,652 | 40.1 | 2.1 | 100.0% | Escherichia coli str. K-12 substr. MG1655, complete genome. |
| total | 4,641,652 | 100.0% |
fit dispersion is the ratio of the variance to the mean for the negative binomial fit. It is =1 for Poisson and >1 for over-dispersed data.
| option | limit | actual |
|---|---|---|
| Number of alignment pairs examined for constructing junction candidates | ≤ 100000 | 14131 |
| Coverage evenness (position-hash) score of junction candidates | ≥ 2 | ≥ 3 |
| Test this many junction candidates (n). May be smaller if not enough passed the coverage evenness threshold | 100 ≤ n ≤ 5000 | 132 |
| Total length of all junction candidates (factor times the reference genome length) | ≤ 0.1 | 0.009 |
| reference sequence | pr(no read start) |
|---|---|
| NC_000913 | 0.87045 |
pr(no read start) is the probability that there will not be an aligned read whose first base matches a given position on a given strand.
| option | value |
|---|---|
| Coverage evenness (position-hash) score of predicted junctions must be | ≥ 3 |
| Skew score of predicted junction (−log10 probability of unusual coverage evenness) must be | ≤ 3 |
| Number of bases that at least one read must overlap each uniquely aligned side of a predicted junction | ≥ 1 |
| option | value |
|---|---|
| Mode | Consensus/Mixed Base |
| Ploidy | 1 (haploid) |
| Consensus mutation E-value cutoff | 10 |
| Consensus frequency cutoff | 0.75 |
| Consensus minimum variant coverage each strand | OFF |
| Consensus minimum total coverage each strand | OFF |
| Consensus minimum variant coverage | OFF |
| Consensus minimum total coverage | OFF |
| Polymorphism E-value cutoff | 10 |
| Polymorphism frequency cutoff | 0.2 |
| Polymorphism minimum variant coverage each strand | OFF |
| Polymorphism minimum total coverage each strand | OFF |
| Polymorphism minimum variant coverage | OFF |
| Polymorphism minimum total coverage | OFF |
| Polymorphism bias cutoff | OFF |
| Predict indel polymorphisms | YES |
| Skip indel polymorphisms in homopolymers runs of | OFF |
| Skip base substitutions when they create a homopolymer flanked on each side by | OFF |
| program | version |
|---|---|
| bowtie2 | 2.3.4.1 |
| R | 3.4.4 |
| step | start | end | elapsed |
|---|---|---|---|
| Read and reference sequence file input | 15:44:18 27 Feb 2020 | 15:44:39 27 Feb 2020 | 21 seconds |
| Read alignment to reference genome | 15:44:40 27 Feb 2020 | 15:47:23 27 Feb 2020 | 2 minutes 43 seconds |
| Preprocessing alignments for candidate junction identification | 15:47:23 27 Feb 2020 | 15:47:42 27 Feb 2020 | 19 seconds |
| Preliminary analysis of coverage distribution | 15:47:42 27 Feb 2020 | 15:48:24 27 Feb 2020 | 42 seconds |
| Identifying junction candidates | 15:48:24 27 Feb 2020 | 15:48:46 27 Feb 2020 | 22 seconds |
| Re-alignment to junction candidates | 15:48:46 27 Feb 2020 | 15:49:38 27 Feb 2020 | 52 seconds |
| Resolving best read alignments | 15:49:38 27 Feb 2020 | 15:50:08 27 Feb 2020 | 30 seconds |
| Creating BAM files | 15:50:08 27 Feb 2020 | 15:50:45 27 Feb 2020 | 37 seconds |
| Tabulating error counts | 15:50:45 27 Feb 2020 | 15:50:59 27 Feb 2020 | 14 seconds |
| Re-calibrating base error rates | 15:50:59 27 Feb 2020 | 15:51:01 27 Feb 2020 | 2 seconds |
| Examining read alignment evidence | 15:51:01 27 Feb 2020 | 15:53:51 27 Feb 2020 | 2 minutes 50 seconds |
| Polymorphism statistics | 15:53:51 27 Feb 2020 | 15:53:52 27 Feb 2020 | 1 second |
| Output | 15:53:52 27 Feb 2020 | 15:54:03 27 Feb 2020 | 11 seconds |
| Total | 9 minutes 44 seconds | ||