
mutation predictions | marginal predictions | summary statistics | genome diff | command line log
|
breseq version 0.30.0 revision f53f5bf51c1f
mutation predictions | marginal predictions | summary statistics | genome diff | command line log |
| read file | reads | bases | passed filters | average | longest | mapped | |
|---|---|---|---|---|---|---|---|
| errors | qtrim-Atp-I-to-C-KO-16-65_S20_L001_R2_001 | 709,016 | 190,849,594 | 100.0% | 269.2 bases | 301 bases | 96.5% |
| errors | qtrim-Atp-I-to-C-KO-16-65_S20_L001_R1_001 | 709,035 | 191,702,806 | 100.0% | 270.4 bases | 301 bases | 99.0% |
| total | 1,418,051 | 382,552,400 | 100.0% | 269.8 bases | 301 bases | 97.8% |
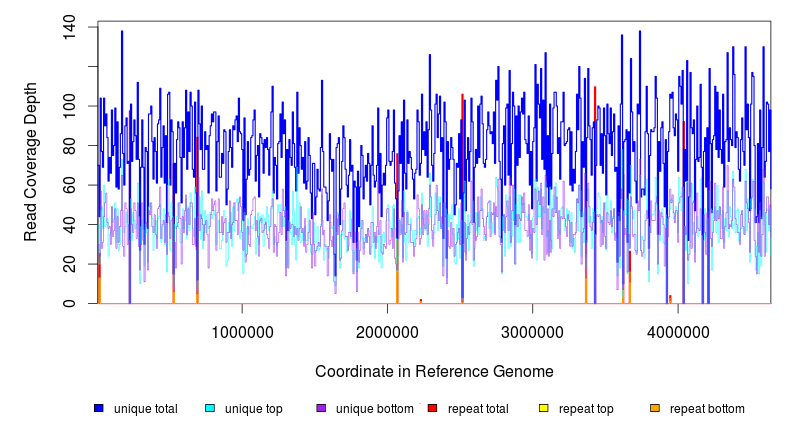
| seq id | length | fit mean | fit dispersion | % mapped reads | description | ||
|---|---|---|---|---|---|---|---|
| coverage | distribution | NC_000913 | 4,638,902 | 83.7 | 4.4 | 100.0% | Escherichia coli str. K-12 substr. MG1655, complete genome. |
| total | 4,638,902 | 100.0% |
fit dispersion is the ratio of the variance to the mean for the negative binomial fit. It is =1 for Poisson and >1 for over-dispersed data.
| option | limit | actual |
|---|---|---|
| Number of alignment pairs examined for constructing junction candidates | ≤ 100000 | 2362 |
| Coverage evenness (position-hash) score of junction candidates | ≥ 2 | ≥ 2 |
| Test this many junction candidates (n). May be smaller if not enough passed the coverage evenness threshold | 100 ≤ n ≤ 5000 | 163 |
| Total length of all junction candidates (factor times the reference genome length) | ≤ 0.1 | 0.021 |
| reference sequence | pr(no read start) |
|---|---|
| NC_000913 | 0.88858 |
pr(no read start) is the probability that there will not be an aligned read whose first base matches a given position on a given strand.
| option | value |
|---|---|
| Coverage evenness (position-hash) score of predicted junctions must be | ≥ 3 |
| Skew score of predicted junction (−log10 probability of unusual coverage evenness) must be | ≤ 3 |
| Number of bases that at least one read must overlap each uniquely aligned side of a predicted junction | ≥ 1 |
| option | value |
|---|---|
| Mode | Consensus/Mixed Base |
| Ploidy | 1 (haploid) |
| Consensus mutation E-value cutoff | 10 |
| Consensus frequency cutoff | 0.8 |
| Consensus minimum coverage each strand | OFF |
| Polymorphism E-value cutoff | 10 |
| Polymorphism frequency cutoff | 0.2 |
| Polymorphism minimum coverage each strand | OFF |
| Polymorphism bias cutoff | OFF |
| Predict indel polymorphisms | YES |
| Skip indel polymorphisms in homopolymers runs of | OFF |
| Skip base substitutions when they create a homopolymer flanked on each side by | OFF |
| program | version |
|---|---|
| bowtie2 | 2.2.6 |
| R | 3.3.1 |
| step | start | end | elapsed |
|---|---|---|---|
| Read and reference sequence file input | 23:55:53 24 Apr 2017 | 23:56:25 24 Apr 2017 | 32 seconds |
| Read alignment to reference genome | 23:56:26 24 Apr 2017 | 23:58:36 24 Apr 2017 | 2 minutes 10 seconds |
| Preprocessing alignments for candidate junction identification | 23:58:36 24 Apr 2017 | 23:59:28 24 Apr 2017 | 52 seconds |
| Preliminary analysis of coverage distribution | 23:59:28 24 Apr 2017 | 00:00:52 25 Apr 2017 | 1 minute 24 seconds |
| Identifying junction candidates | 00:00:52 25 Apr 2017 | 00:00:57 25 Apr 2017 | 5 seconds |
| Re-alignment to junction candidates | 00:00:57 25 Apr 2017 | 00:01:16 25 Apr 2017 | 19 seconds |
| Resolving alignments with junction candidates | 00:01:16 25 Apr 2017 | 00:02:49 25 Apr 2017 | 1 minute 33 seconds |
| Creating BAM files | 00:02:49 25 Apr 2017 | 00:03:35 25 Apr 2017 | 46 seconds |
| Tabulating error counts | 00:03:35 25 Apr 2017 | 00:05:16 25 Apr 2017 | 1 minute 41 seconds |
| Re-calibrating base error rates | 00:05:16 25 Apr 2017 | 00:05:17 25 Apr 2017 | 1 second |
| Examining read alignment evidence | 00:05:17 25 Apr 2017 | 00:19:09 25 Apr 2017 | 13 minutes 52 seconds |
| Polymorphism statistics | 00:19:09 25 Apr 2017 | 00:19:09 25 Apr 2017 | 0 seconds |
| Output | 00:19:09 25 Apr 2017 | 00:19:23 25 Apr 2017 | 14 seconds |
| Total | 23 minutes 29 seconds | ||