Sample Resequencing Stats
Note: The mutation counts shown below represent unfiltered mutation sets.
| ALE, Flask, Isolate |
Predicted Mutations |
Mean Coverage |
Total Reads |
Percent Mapped |
Mapped Reads |
Average Read Length |
|
A5 F210 I1 R1
|
4929 |
268.4 |
3907572 |
96.3% |
3762991 |
273.2 |
Breseq alignment
BRESEQ :: Evidence
|
| evidence |
seq id |
position |
mutation |
annotation |
gene |
description |
| MC JC |
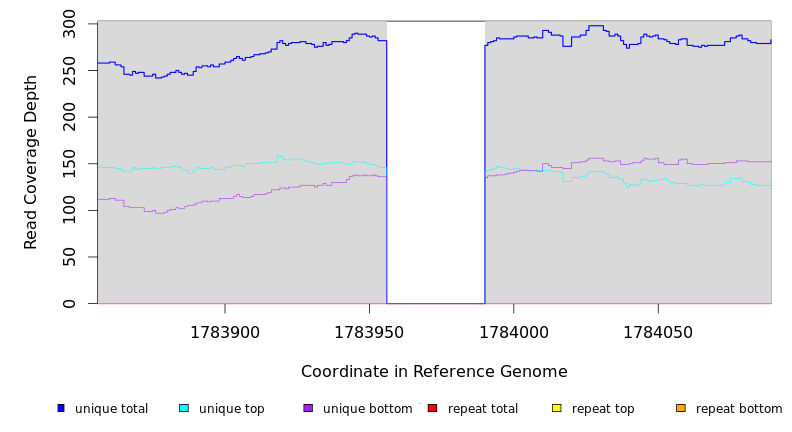
CP042583 |
1,783,956 |
34 bp→TCATG |
intergenic (–/–) |
– / – |
–/– |
|
| | | | seq id |
start |
end |
size |
←reads |
reads→ |
gene |
description |
|---|
| * |
* |
÷ |
CP042583 |
1783956 |
1783989 |
34 |
282 [0] |
[0] 277 |
–/– |
–/– |
|
| |
seq id |
position |
reads (cov) |
reads (cov) |
score |
skew |
freq |
annotation |
gene |
product |
| * |
? |
CP042583 |
= 1783955 | 0 (0.000) | 277 (1.090)
+TCATG |
128/534 |
0.3 |
100% |
intergenic (–/–) |
–/– |
–/– |
| ? | CP042583 |
1783990 = |
0 (0.000) | intergenic (–/–) |
–/– |
–/– |
GATK/CNVnator alignment
N/A