Sample Resequencing Stats
Note: The mutation counts shown below represent unfiltered mutation sets.
| ALE, Flask, Isolate |
Predicted Mutations |
Mean Coverage |
Total Reads |
Percent Mapped |
Mapped Reads |
Average Read Length |
|
A1 F17 I0 R2
|
276 |
45.3 |
3729697 |
93.0% |
3468618 |
60.6 |
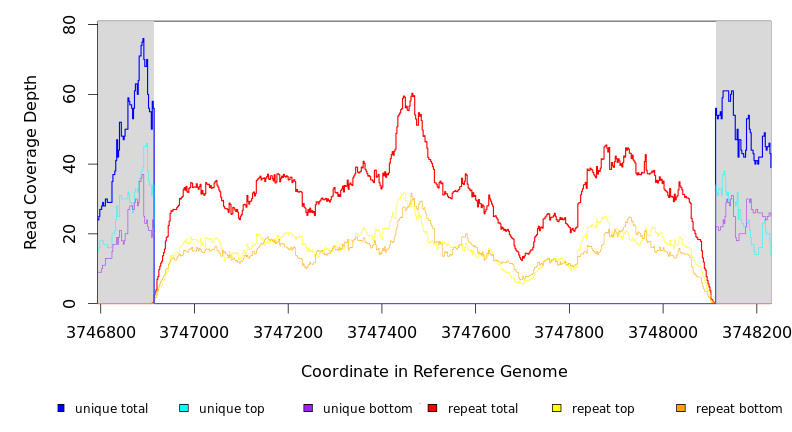
Breseq alignment
BRESEQ :: Evidence
|
| evidence |
seq id |
position |
mutation |
freq |
annotation |
gene |
description |
| MC JC |
W3110S.gb |
3,746,913 |
Δ1,199 bp |
100% |
|
[tnaB]–[tnaB] |
[tnaB], insH, [tnaB] |
|
| | | | seq id |
start |
end |
size |
←reads |
reads→ |
gene |
description |
|---|
| * |
* |
÷ |
W3110S.gb |
3746913–3748110 |
3748111 |
2–1199 |
56 [0] |
[0] 56 |
[tnaB]–[tnaB] |
[tnaB],insH,[tnaB] |
|
| |
seq id |
position |
reads (cov) |
reads (cov) |
score |
skew |
freq |
annotation |
gene |
product |
| * |
? |
W3110S.gb |
= 3746912 | 0 (0.000) | 38 (1.120) |
20/92 |
NT |
100% |
coding (71/447 nt) |
tnaB |
tryptophan transporter of low affinity |
| ? | W3110S.gb |
3748112 = |
0 (0.000) | coding (871/984 nt) |
tnaB |
tryptophan transporter of low affinity |
GATK/CNVnator alignment
N/A