Sample Resequencing Stats
Note: The mutation counts shown below represent unfiltered mutation sets.
| ALE, Flask, Isolate |
Predicted Mutations |
Mean Coverage |
Total Reads |
Percent Mapped |
Mapped Reads |
Average Read Length |
|
A23 F28 I1 R1
|
18 |
13.2 |
538532 |
91.0% |
490064 |
126.1 |
Breseq alignment
BRESEQ :: Evidence
|
| evidence |
seq id |
position |
mutation |
annotation |
gene |
description |
| MC JC |
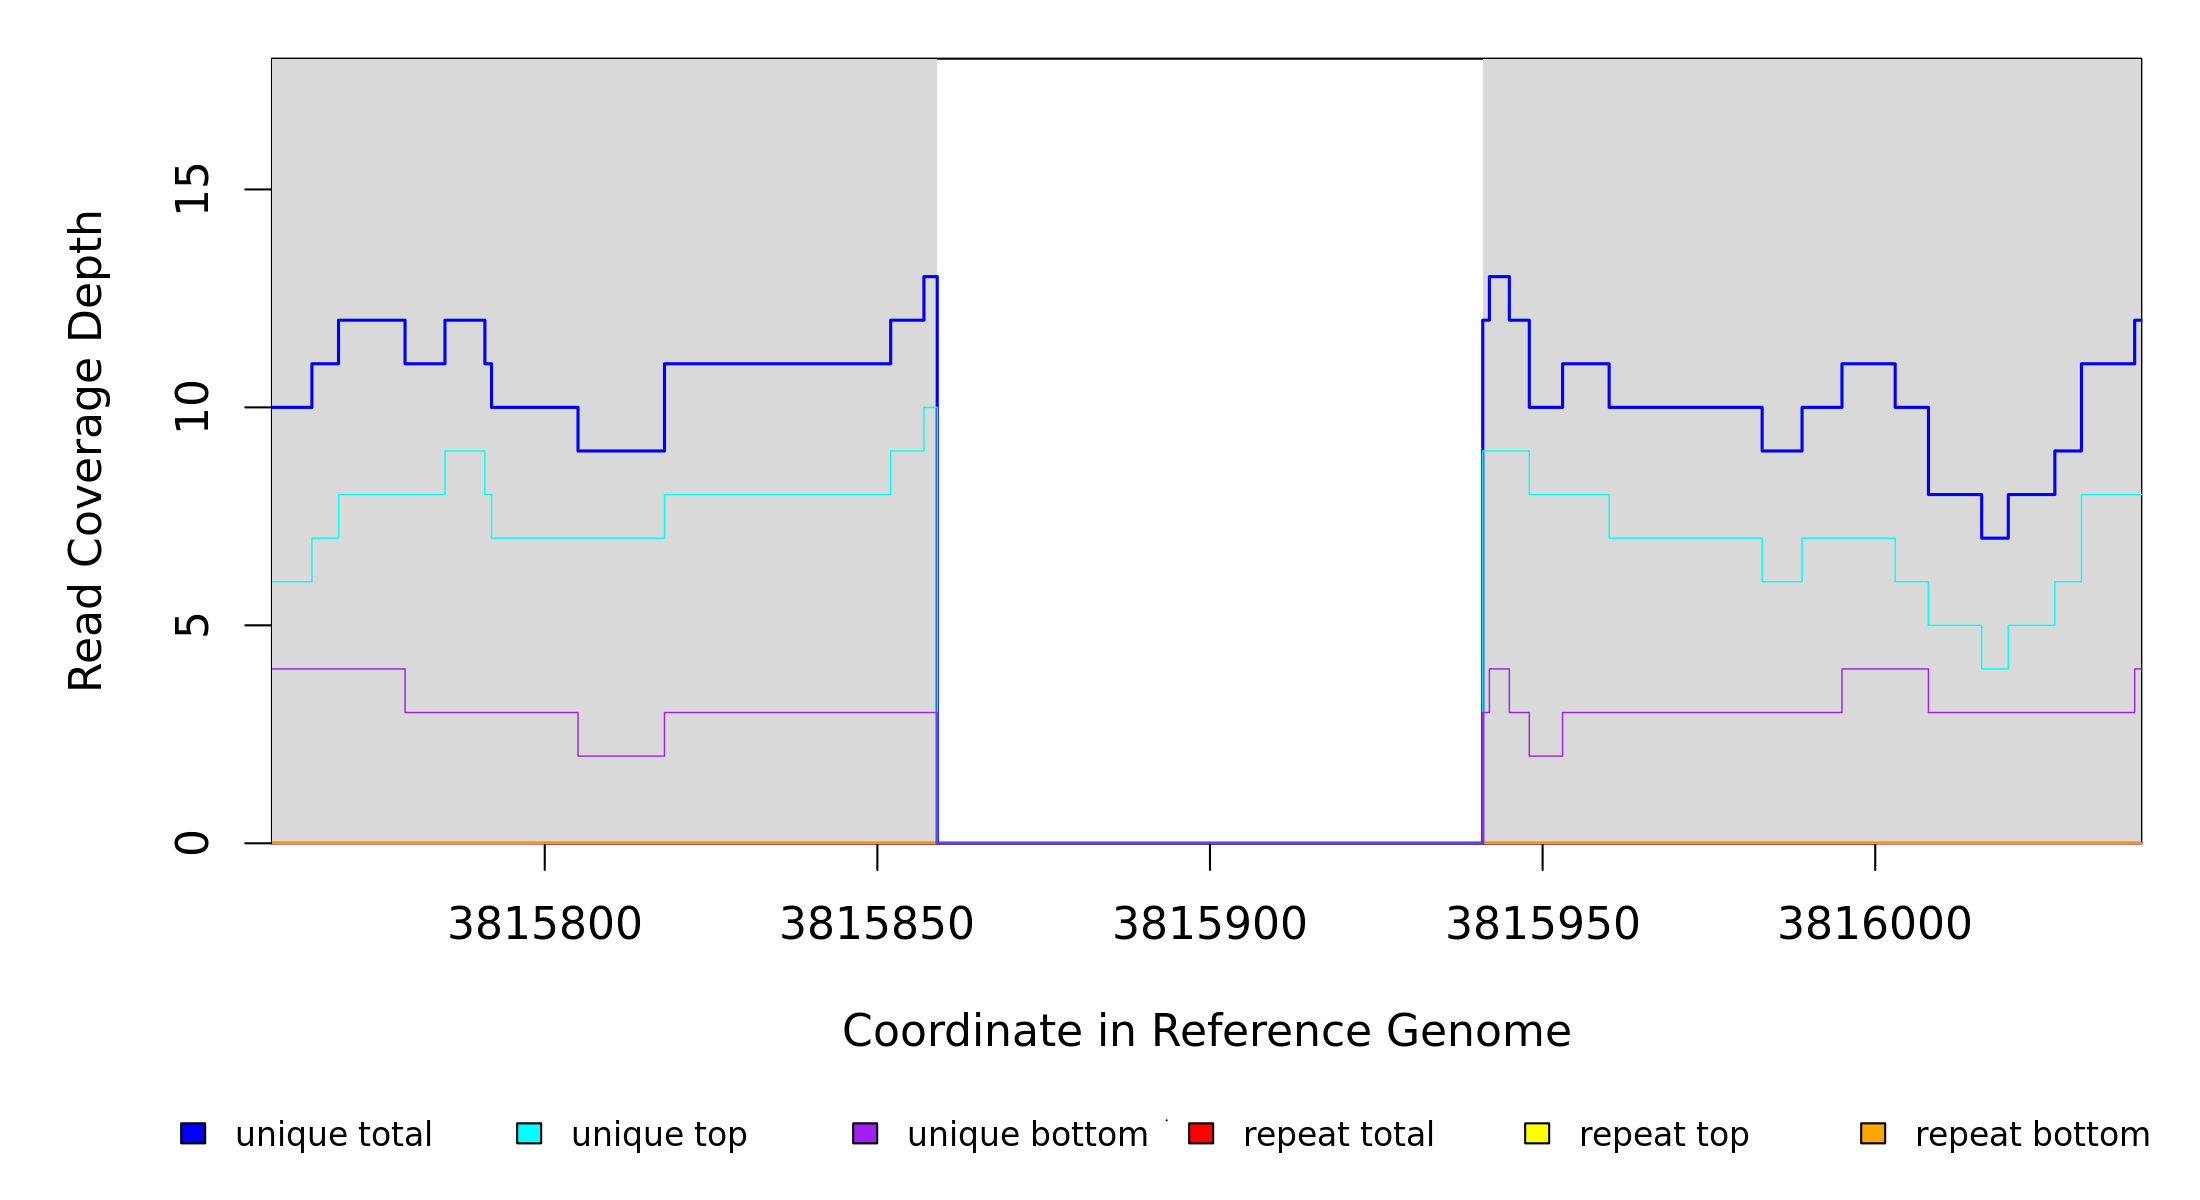
NC_000913_3_pae_tpiA |
3,815,859 |
Δ82 bp |
|
[rph]–[rph] |
[rph], [rph] |
|
| | | | seq id |
start |
end |
size |
←reads |
reads→ |
gene |
description |
|---|
| * |
* |
÷ |
NC_000913_3_pae_tpiA |
3815859 |
3815940 |
82 |
13 [0] |
[0] 12 |
[rph]–[rph] |
[rph],[rph] |
|
| |
seq id |
position |
reads (cov) |
reads (cov) |
score |
skew |
freq |
annotation |
gene |
product |
| * |
? |
NC_000913_3_pae_tpiA |
= 3815858 | 0 (0.000) | 10 (0.830) |
10/230 |
0.3 |
100% |
pseudogene (24/48 nt) |
rph |
ribonuclease PH (defective);enzyme; Degradation of RNA; RNase PH |
| ? | NC_000913_3_pae_tpiA |
3815941 = |
0 (0.000) | pseudogene (609/669 nt) |
rph |
ribonuclease PH (defective);enzyme; Degradation of RNA; RNase PH |
GATK/CNVnator alignment
N/A