Sample Resequencing Stats
Note: The mutation counts shown below represent unfiltered mutation sets.
| ALE, Flask, Isolate |
Predicted Mutations |
Mean Coverage |
Total Reads |
Percent Mapped |
Mapped Reads |
Average Read Length |
|
A17 F32 I1 R1
|
16 |
62.7 |
2456702 |
94.1% |
2311756 |
129.8 |
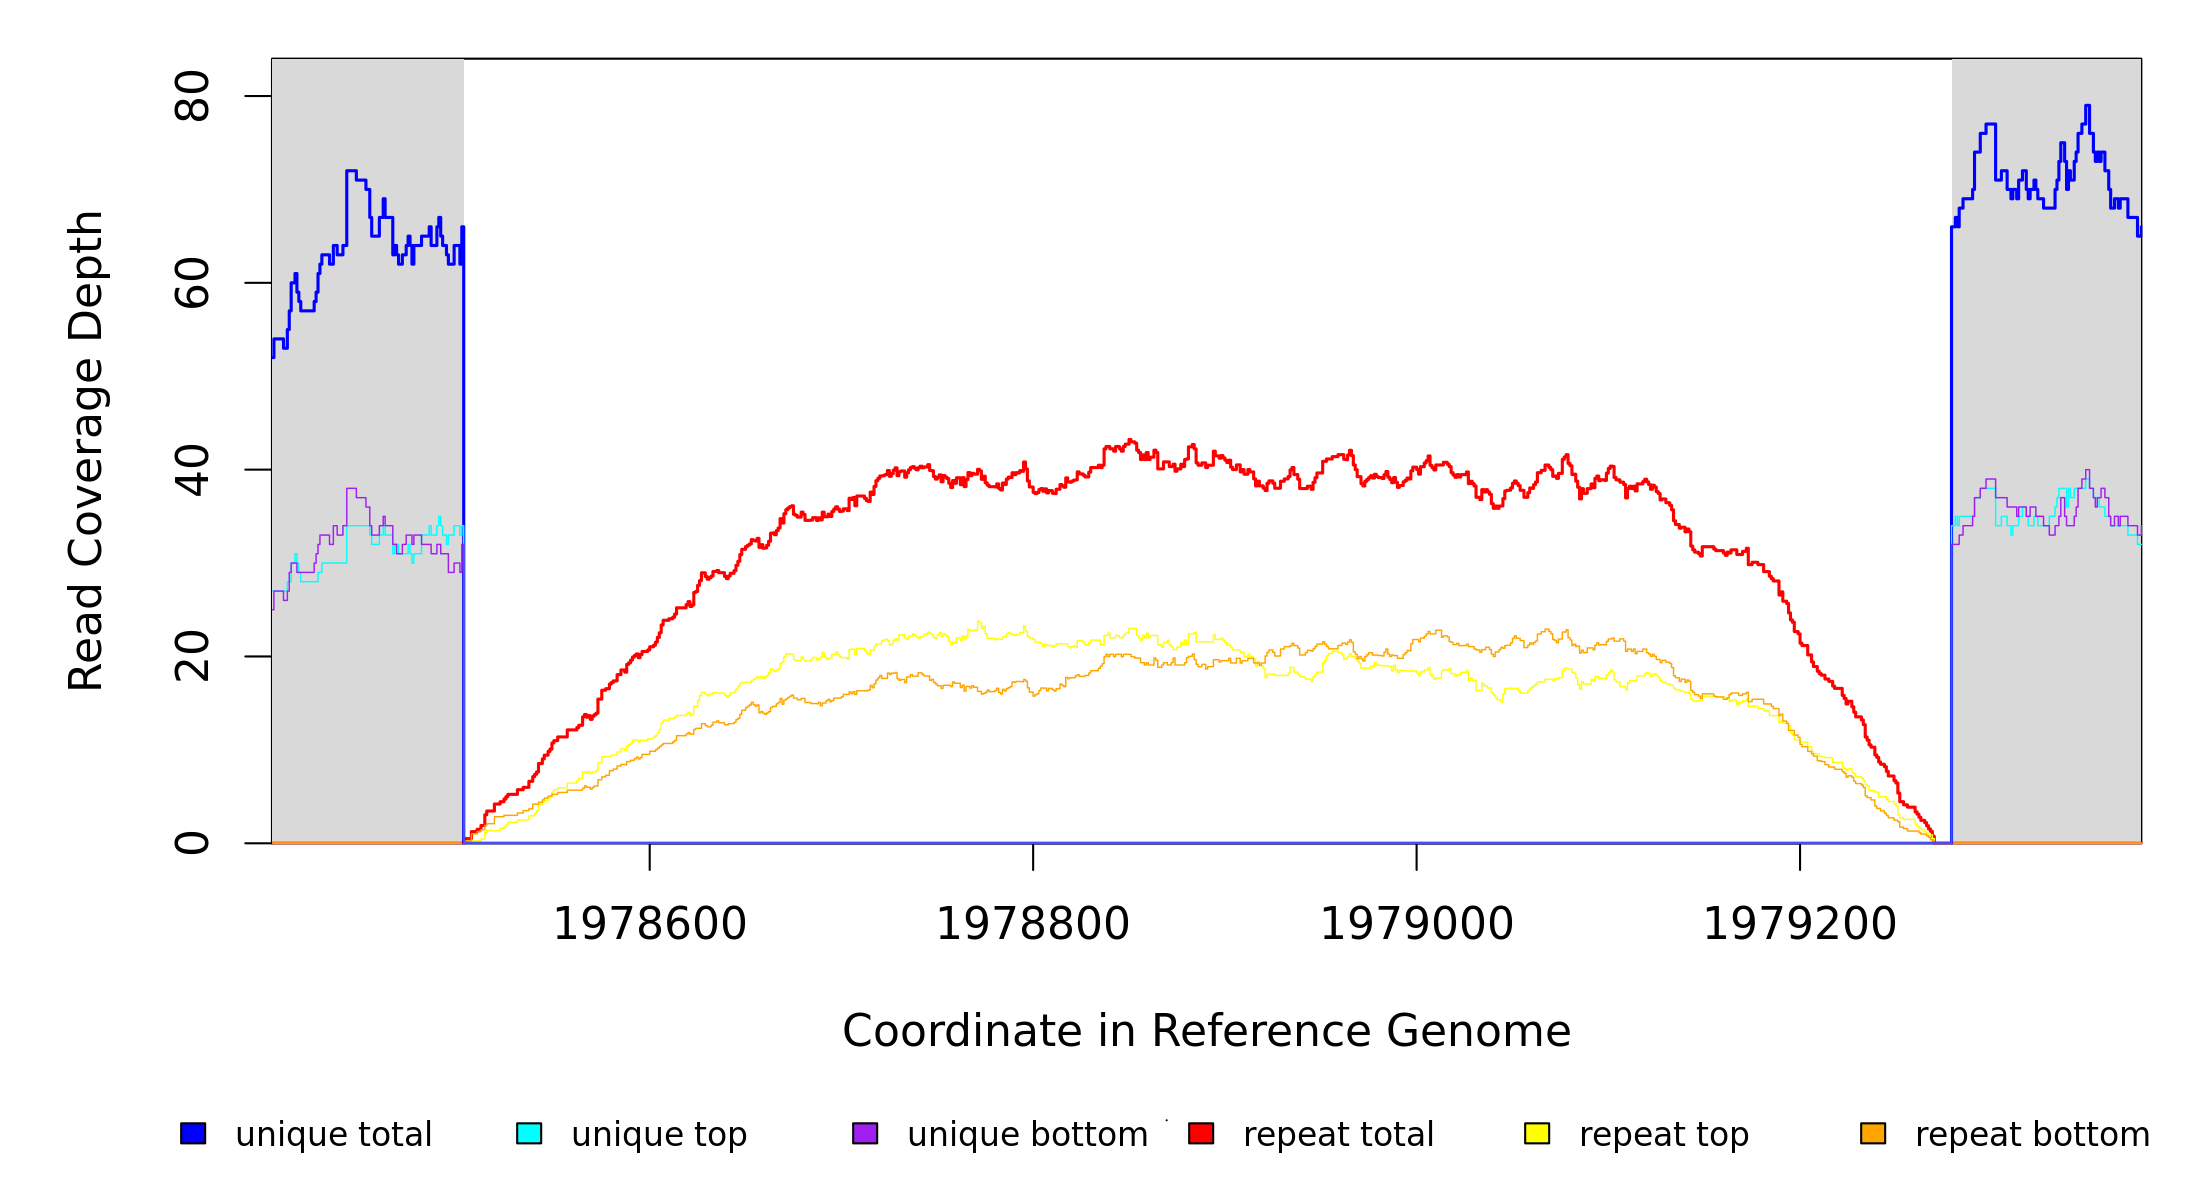
Breseq alignment
BRESEQ :: Evidence
|
| evidence |
seq id |
position |
mutation |
annotation |
gene |
description |
| MC JC |
NC_000913_3_pae_tpiA |
1,978,503 |
Δ776 bp |
|
insB1–insA |
insB1, insA |
|
| | | | seq id |
start |
end |
size |
←reads |
reads→ |
gene |
description |
|---|
| * |
* |
÷ |
NC_000913_3_pae_tpiA |
1978503–1979269 |
1979278 |
10–776 |
66 [0] |
[0] 66 |
insB1–insA |
insB1,insA |
|
| |
seq id |
position |
reads (cov) |
reads (cov) |
score |
skew |
freq |
annotation |
gene |
product |
| * |
? |
NC_000913_3_pae_tpiA |
= 1978502 | 0 (0.000) | 58 (0.970) |
45/242 |
0.5 |
100% |
intergenic (‑305/+16) |
flhD/insB1 |
flagellar class II regulon transcriptional activator, with FlhC/IS1 transposase B |
| ? | NC_000913_3_pae_tpiA |
1979279 = |
0 (0.000) | intergenic (‑64/‑474) |
insA/uspC |
IS1 repressor TnpA/universal stress protein |
GATK/CNVnator alignment
N/A